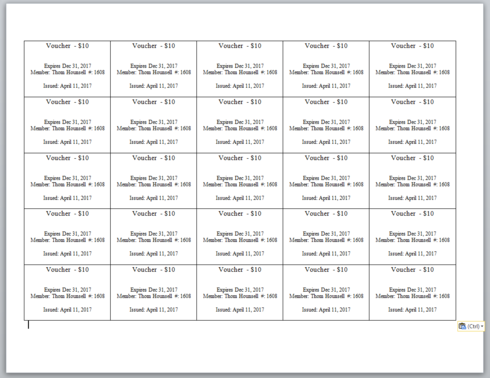
ContributionsMost RecentMost LikesSolutionsRe: validate date fields before savingAh, I didn't see notice that I could include conditions other than those related to field actions. Thanks.validate date fields before savingI want to record the dates on which a boat will be leaving and returning to their dock. I don't want the return date to predate the departure date. I see how I can use a dynamic message to warn the user of invalid dates, but it lets them save it anyways. (Seems to me that "prevent save" would be a good action to include in dynamic forms.) But that doesn't seem to be an option. I thought maybe a formula field holding the duration between the two dates would also work, but I don't see how the calculated field would be validated. Am I missing something, or is this a glaring gap in the product design?Re: Can I make a report with repeating use of fields?Thanks Dan, This looks great. I'm new to quickbase and very rusty on my web skills so I may be missing something. I tried to follow your directions for the [script] technique but I must have missed a step somewhere. I'll try again as time permits. Re: Can I make a report with repeating use of fields?Okay thanks. Here's what I'm thinking this would look like... Re: Can I make a report with repeating use of fields?There's really not much to see. I have a table of members and I basically want to print the member name, member #, and the year in each cell of a 5x5 table. I want that table to be the only thing printed on an 8x11 page, and I want to print 1 page per member. Thanks.Can I make a report with repeating use of fields?I'm replacing my sailing club's Access database with a QB app. One of the outputs from the Access version is a report that is used to issue food tickets to members. The report is a single page per member with the member's name, number and year printed on each cell in a 5x5 table. Is it possible to do something similar in QB? I think I can imagine a solution involving a child table for the tickets with the output arranged in some sort of crosstab report, but that seems like a lot of work. Is there another approach that would make more sense? Thanks in advance!Display summary stats from 2 detail tables in one calculationURRGG! I'm a QB newbie and stuck on some basics. The app is for a boating club. I have a table of Members and a table recording the Hours Worked recording the volunteer work each member has completed. Each member promises to complete 20hrs of volunteering. I'm trying to make a little pie chart that shows the club total number of hours worked and unworked. To do so, I need a place where I can count the member records and sum the hours worked. But finding a way to reference both tables seems to be eluding me. After reading through previous posts, I've gleaned that I might also need a Statistics table, so I've added one of those and made both the Members and Hours Worked tables details of Statistics. I thought it would be smooth sailing after that but I'm stuck on the shoals of things not working the way I would have guessed they should. Much appreciate any help.