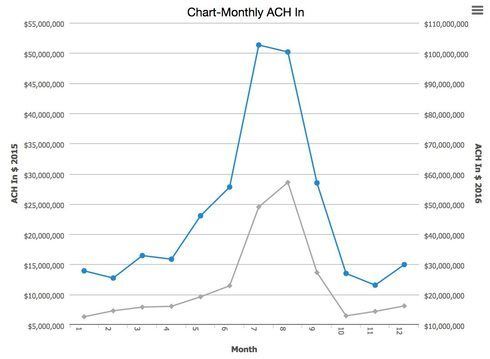
ContributionsMost RecentMost LikesSolutionsHow to show a variance in excess of X% between recordsI have a table that shows the dollar amount of monthly transactions for each account. Every month we upload the new monthly totals for all the accounts. I'd like to be able to identify those rows where the dollar amount for a given month is in excess of 120% of the dollar amount for the same month the previous year for each account. I can't seem to wrap my mind around how to do that. What am I missing? My fields include: [Account #] [Month] [Year] [End of Month for the month in question, basically a normal MM/DD/YYYY date field] [$ Amount] Any suggestions? Thanks in advance.Re: Track Changes with Formula Field?Most of the conditions become present while a user edits a record, but some are based on time-related elements, like whether a certain date is within the last 365 days. So some sort of script?Track Changes with Formula Field?I have a formula field (let's call it "Status") that looks at several fields and if a certain combination of conditions exist, the result is "High", if another set of conditions exist the result is "Medium" and everything else is "Low." I would like to be able to track when that status changes from one state to another, because when something changes to "High," people need to know because they have certain things they need to do with these records within 30 days. I created a new text field called "Status Change Log" and set it to log the edits of changes to the "Status" field using a dynamic form rule. I was pretty excited about all this, but when I made some changes to the underlying conditions, nothing was being recording in the "Status Change Log." If I'm understanding correctly from QB support, it looks like changes in my formula "Status" field aren't detected as changes by the dynamic form rules. Anybody have any idea for a way around this? It's not that I just want to know when the conditions for "High" are present, because they will be present for some records already. I'm interested in knowing what records are now "High" that weren't before.Force Secondary Chart Y Axis to Use Same Scale as Primary Y AxisI have a line chart that shows activity for one year on the primary Y axis and activity for a second year on the secondary & axis. It would be helpful if both the primary and secondary axes used the same scale to facilitate comparisons between the activity for the two years. But the scale of the secondary axis will frequently be considerably different than that of the primary axis(see attached image to see how it can be misleading). I can see the value of having the axes have their scale automatically formed based on the data, but is there a way to force that secondary axis scale to remain the same as the primary axis scale? If not off the shelf, is this something that could be reasonably customized (and if so, could anybody point me in the right direction?)?