Calendar Report
Hello, I need help with quickbase calendar report. I currently have a field called start date which has list of companies. I have a another field called frequency which is multiple choice field consisting of daily weekly semi-monthly and monthly. I want to have calendar show the records which falls in the freqency range from start date. Can it be achieved in quickbase? ------------------------------ XYZ XYZ ------------------------------147Views0likes4CommentsUsing custom data rules to cleanse data in tables?
Hi all... I was searching this morning on the internet for a "how to" on creating exception reporting in QB. I came across several posts on using custom rules to validate data during input/imports. I have a need to validate data that is currently in tables within the QB app that was developed. This app has been in existence for a few months and it looks like the data that has been added by users is not always correct. I'm trying to find a way to evaluate all the data in various tables and identify exceptions to business rules. Ideally I'd like to have a report that does this validation daily so that the data remains clean. Any thoughts on how this can be accomplished? ------------------------------ Marcia Miller ------------------------------7Views0likes0Commentssummary report formulas
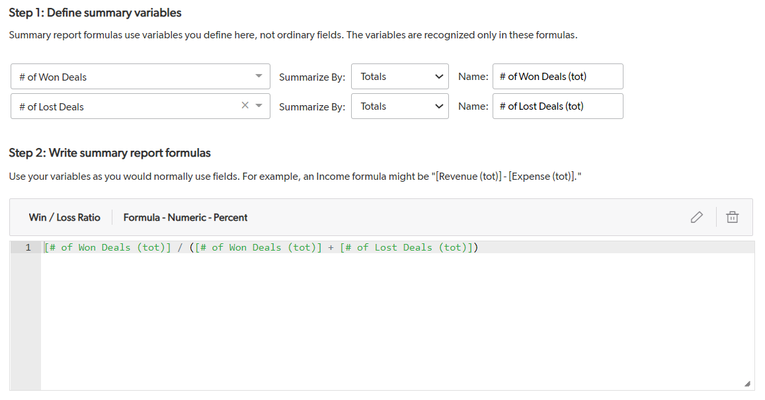
As a Data Analyst at Quickbase, I'm often asked to create reports and scorecards to track our performance over time. In most cases, it's easy to provide this data with the summary report feature – it can be done simply by adding the numeric fields to the report, choosing how to aggregate them (sum, average, etc.) and grouping by the appropriate date fields. But what can you do when you're asked to perform additional calculations on those aggregated metrics? Some people refer to this as the averages of averages problem, even though it is much more! There are plenty of these scenarios in every department: lead conversion in marketing, quota attainment in sales, net retention in finance, just to name a few… Also, different business units often have their own targets, and they need reports to inform how they are executing against them on a monthly, quarterly and annual basis. Since this was not possible on summary reports, my usual workaround was creating new tables, adding summary fields and doing the final calculations there. I'm very excited that now our product has a new feature called summary report formulas, which makes those calculations much easier than before, and will save me a lot of time and effort! Now, all I need to do is create a summary report on my source table, choose how to group my data and follow 3 simple steps: 1. Define summary variables – Simple example – Calculating win / loss ratio in Sales. Values to define: Total # of won deals Total # of lost deals. Complex example: Calculating utilization ratio against target for a customer support center. Values to define: Duration of direct customer support (hours) Duration of additional customer support tasks (hours) # of vacation hours # of sick leave hours 2. Write summary report formula – Formula to calculate win / loss ratio: Total # of won deals/ (Total # of won deals + Total # of lost deals) Formula to calculate utilization ratio against target (assuming that the report is grouped by week and by rep, each support rep works 40h a week and is expected to have a utilization of 60%): (Duration of direct customer support (hours) + Duration of additional customer support tasks (hours)) / (40 - # of vacation hours - # of sick leave hours) / 0.6 3. Add my new field(s) to the report. This way, instead of creating separate tables with calculations for each time period, I can build all of my reports with percentage calculations on the same table. Stakeholders won't have to wait for me to create a few tables, join them, add summary fields, and then write the formulas to get the results. Thanks to summary report formulas, I will be able to deliver data to the business in minutes, rather than days and hours! This feature is currently in beta. You can express interest in our beta registration application. We are inviting people into the program in waves but if you believe you have a use case that may enable you to provide valuable feedback on this feature, please reach out to your account team. ------------------------------ Aleksandra Cybulska ------------------------------58Views0likes0CommentsSummary Report Formatting
Hello: I am trying to create a CSV output file from a Summary Report that must list the content of 12 fields. I will be grouping and Summarizing content in only three fields. It seems Quick Base limits this report content to only 6 Fields? Can someone confirm? Are their any other options? Thank you for any help you may provide. Dirk ------------------------------ Dirk Ruana ------------------------------8Views0likes0CommentsConditional report emailing?
Hi there - greetings from the Merchandise Mart in River North! The main app we have here at Allstate is a weekly timesheet app where everyone enters their working hours at the end of the week - it's just a single field that holds the numeric value of how many total hours for that week. It's a very simple app by design. The unfortunate part is that not everyone gets their timesheet in on time... so when Monday comes around what I'd like to do is to mail a report to only people with "hours" <40... is that even possible? I can see a lot of material on conditional statements and usage, but nothing looks to pertain to reports/emailing/etc... Thanks for any help or even just pointing in the right direction. Cheers! ------------------------------ Dustin Hamilton Product Design Manager | Allstate ------------------------------12Views0likes1Comment
