BobThomas1
3 years agoQrew Cadet
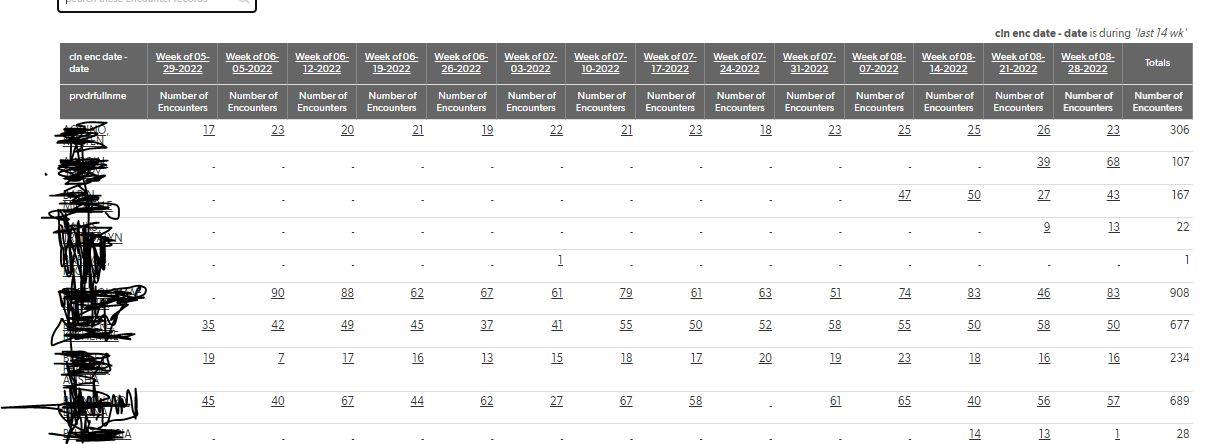
How can I compare the columns of this Provider-Encounters Summary Table?
I have created a summary table of providers and the number of encounters (routine short patient visits). This table is setup weekly for the past 14 weeks. What I want to do is to compare the last few weeks to the current week & take an average and put in a new field, such as 3 Month Moving Average. I know the formula previous two months encounters + current month encounters and all divided by three.
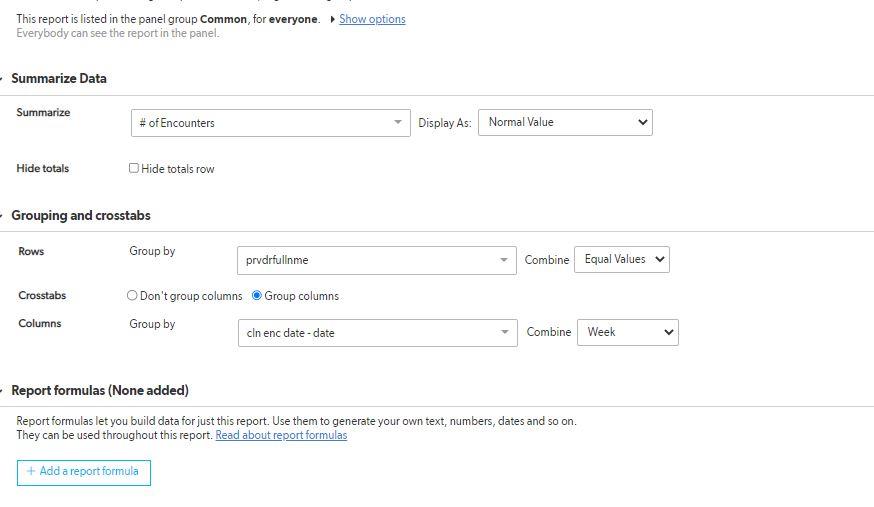
What I'm trying to do is to get a formula to add the three months of encounters for each provider. But the data is setup by grouping and crosstabs, so their aren't actual field data, since the data is crunched by the grouping & crosstabs.
I am thinking doing a query is the way to go? The Encounter date is updated by BOX at regular intervals or manually. The provider and encounter date with other fields are added as one record. So if Provider Jeff Smith has 7 encounters today, then Sep 9, 2022 shows up 7 times with the provider name Jeff Smith.
------------------------------
Bob T.
------------------------------