Force Secondary Chart Y Axis to Use Same Scale as Primary Y Axis
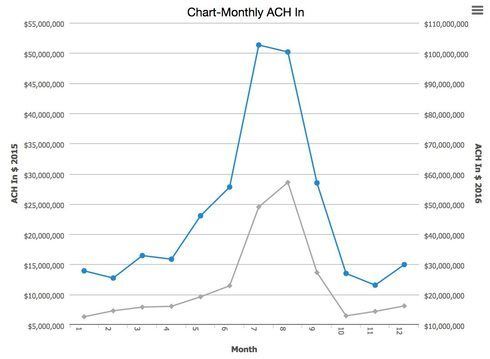
I have a line chart that shows activity for one year on the primary Y axis and activity for a second year on the secondary & axis. It would be helpful if both the primary and secondary axes used the s...
QuickBase has tightly bound specific charts to queries of table data. As a result if there is no control or setting to manipulate in the chart builder page you have no native option to modify the chart's characteristics. At this point you have to options to get a custom chart:
(1) use a three step process to create a fully custom chart (a) gather your raw date using JavaScript and the QuickBase API, (b) process the data (count, filter, aggregate, bin etc) using JavaScript and libraries such as jQUery and Underscore, (QuickBase uses these libraries so they are already including on your page), and (c) throw the processed data into the setting object of HighChart along with all the other parameters that define the chart.
(2) If you desired chart just needs a few tweaks to a QuickBase rendered chart you can use the technique demoed in the application to modify the chart:
In both cases the demos render a QuickBase chart and then after a delay re-render it with a small change. The delay is just to bedazzle you - in a production application the change will show up almost instantly.
The change you want can be observed in these two jsFiddles and you can observe the slight differences in code by comparing the JavaSccript tabs as well as looking at the screenshot below:
Taken together the changes delete the second axes and tell the second time series to use the first axis definition.
As applied to your chart you would have to follow a similar procedure as in the Hylo demo. What the code in the Hylo demo does is render the native QuickBase chart, extract the settings object and modify it and then re-render the chart. This may sound wickedly complex but the code is short.
If you need further assistance implementing this feel free to contact me off-world using the information in my profile: