Forum Discussion

M_A_Admin's avatar
M_A_Admin
Qrew Member
4 years ago

How do i calculate monthly balance for multiple product?

I work in a project delivery department
The department source a few products from overseas and we use quickbase to facilitate the delivery and orders
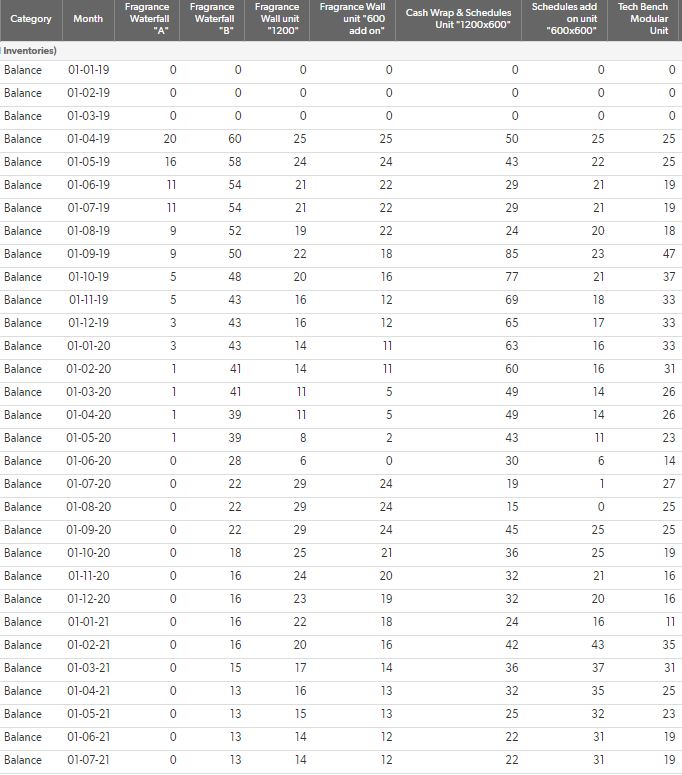
we currently extract all data into excel and use excel to report the products balance each month.
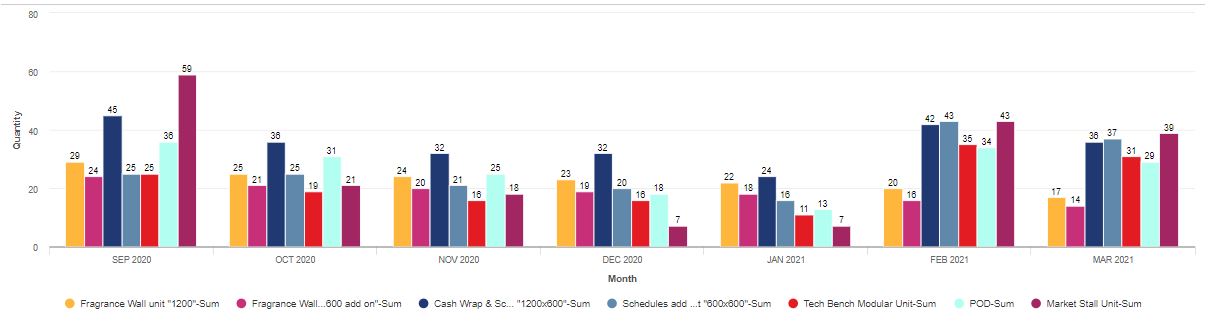
we have been trying hard to find a solution within Quickbase to provide a live update  in graph format each time the product movement is updated/created
below is a screen shot of the graph we try to achieve in Quickbase
any help is much appreciated


------------------------------
Leon Wong
------------------------------

5 Replies

  • The graph that you're trying to create is certainly attainable in Quick Base, but I suspect your application is not setup to allow for it. Can you share more information about how your application table/relationship structure is laid out?

    ------------------------------
    Blake Harrison
    bharrison@datablender.io
    DataBlender - Quick Base Solution Provider
    Atlanta GA
    404.800.1702 / http://datablender.io/
    ------------------------------
    • M_A_Admin's avatar
      M_A_Admin
      Qrew Member
      Hi Blake

      I am restructuring the APP (nothing has been setup yet) so that the team can get the above sample report on Quickbase
      I am able to get around using excel connection to download the usage into excel, formulate them and feed the numbers back into Quickbase in the above table format. However, this means the team can view this in live environment and this creates another manual process

      I have tried several times, the relationship i created is able to pick up the stock movement for each month (ie a month table that has many orders/movements) and i struggle to come up idea that is able to summarise the balance for each month for each product without potentially creating hundred of fields.

      We try to future proof this in the future as the department might source more products.

      appreciate your help

      thanks


      ------------------------------
      Leon Wong
      ------------------------------
      • BlakeHarrison's avatar
        BlakeHarrison
        Qrew Captain
        Well, you're going to need to create a more complex table structure within your application. If you need to be able to see the numbers for sales Per Product, Per Month, you will need something along these lines:

        Of course, this is a very simplified version, but with this structure, you would be able to do Summary fields of your sales numbers from the Line Item to the Product Month and then create the report from the Product Months table.


        ------------------------------
        Blake Harrison
        bharrison@datablender.io
        DataBlender - Quick Base Solution Provider
        Atlanta GA
        404.800.1702 / http://datablender.io/
        ------------------------------