Forum Discussion
BlakeHarrison
5 years agoQrew Captain
Well, you're going to need to create a more complex table structure within your application. If you need to be able to see the numbers for sales Per Product, Per Month, you will need something along these lines:
------------------------------
Blake Harrison
[email protected]
DataBlender - Quick Base Solution Provider
Atlanta GA
404.800.1702 / http://datablender.io/
------------------------------
Of course, this is a very simplified version, but with this structure, you would be able to do Summary fields of your sales numbers from the Line Item to the Product Month and then create the report from the Product Months table.
------------------------------
Blake Harrison
[email protected]
DataBlender - Quick Base Solution Provider
Atlanta GA
404.800.1702 / http://datablender.io/
------------------------------
M_A_Admin
5 years agoQrew Member
Thanks Blake. your flowchart and guidance have given me some ideas !!!
manage to work out with less tables (not sure if this concept is similar to your thought process)
what i did
1. Product (master) connects to product movements (child)
2. summarise monthly movement into Master table (12 new summary fields)
3. Create accumulated fields for each month against each product in product table (another 11 new summary fields)
4.create accumulated lookup fields in Product Movement table (child) for each month (12 new lookup fields)
5. create a formula field to workout the balance each record should pick up
6. Month table (master) connects to Product movement table (child)
7. Create average summary field for each product in month table
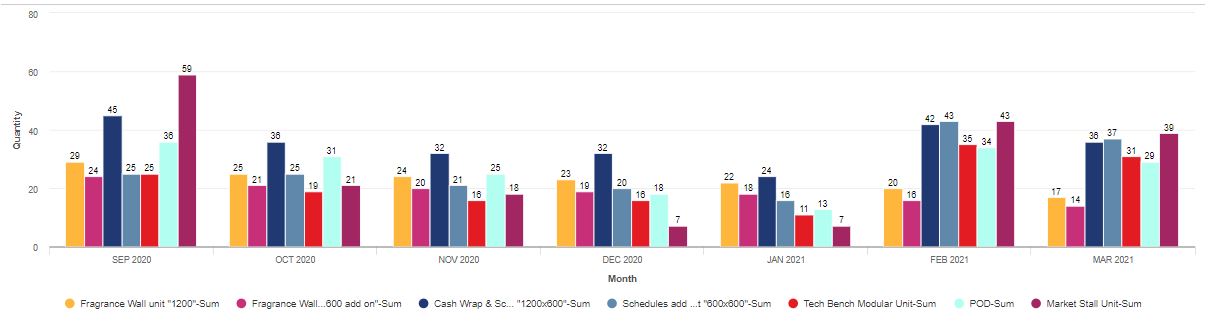
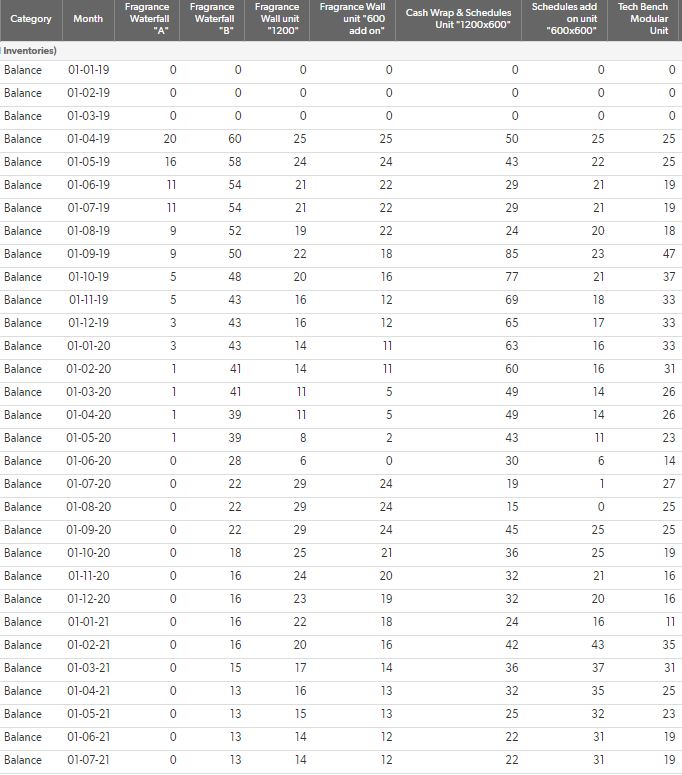
i will then get the below table on Quickbase that calculates the accumulated usage in each month for each product which is identical to Excel
------------------------------
Leon Wong
------------------------------
manage to work out with less tables (not sure if this concept is similar to your thought process)
what i did
1. Product (master) connects to product movements (child)
2. summarise monthly movement into Master table (12 new summary fields)
3. Create accumulated fields for each month against each product in product table (another 11 new summary fields)
4.create accumulated lookup fields in Product Movement table (child) for each month (12 new lookup fields)
5. create a formula field to workout the balance each record should pick up
6. Month table (master) connects to Product movement table (child)
7. Create average summary field for each product in month table
i will then get the below table on Quickbase that calculates the accumulated usage in each month for each product which is identical to Excel
------------------------------
Leon Wong
------------------------------
 BlakeHarrison5 years agoQrew CaptainWhile this will certainly work for you, I don't recommend it. This structure is not scalable and will require practically constant addition of new fields to accommodate new products, new months, etc. You've added tables, yes, but you're structure is still essentially flat.
------------------------------
Blake Harrison
[email protected]
DataBlender - Quick Base Solution Provider
Atlanta GA
404.800.1702 / http://datablender.io/
------------------------------