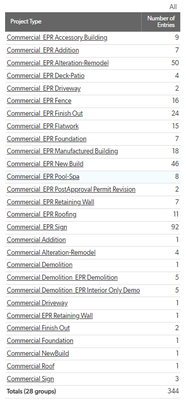
ContributionsMost RecentMost LikesSolutionsRe: Chart - Year over Year for Current Month Mike, you are on to it. If I change the dates on the records in May of 2024 to 05-01-2024 (they were various dates), then it works. I CAN make this work, but it would be better if the formula worked for ANY day in May (and subsequent months). If your suggestion above makes that work, I need a little bit more clarification. Re: Chart - Year over Year for Current Month It's only showing 2023, not 2024. There are no June numbers. It is setup to show last month, since we wouldn't have numbers for June until July. There isn't a table report to look at because this is a formula report, so it won't show up in the table. Right? Re: Chart - Year over Year for Current Month Chayce, for some reason this is no longer working. Only showing May of 2023 and not May 2024 now. Did something change to render this inoperable? Re: How do we get the weekdays in a month? Thank you for this. I just used this today. (I had NO idea QB even existed 7 years ago. I love that help provided back then is still relevant today.) Chart Question Is there a way to "turn off" the legend? For example, these two charts don't need the superfluous "# of projects" on the bottom. Is there a best practice here? SolvedRe: Year Formula help Oh geesh. How simple. I had it as Formula Date because I consider Year a date. But, your reasoning makes sense and of course, it worked. thanks, Mike. Year Formula help Simplest formula out there. Year([Date]) - It works in the formula checker, but nothing is showing up in my table in the Year field. What could be causing this? SolvedRe: Filter Monthly, Quarterly, Yearly from one Date field Mark, I could use help on those formulas. I have a specific use case tonight that I could use for the Quarter specifically. I have a simple date field, so want to pull fiscal quarter from that date. FY starts Oct 1. Re: Share your feedback on the new Qrew Discussions While I wouldn't describe it as awful, annoying would be my word, I experience the same thing. Every time i come here, I get the cookie popup. Pie Chart Help I have a list of "Project Types". Attached is a summary report of this table and field. But, I really want to show it in a Pie Chart. Specifically, I want "Commercial EPR New Build and "Commercial NewBuild" grouped into one category and then all others in a "Other" category. I am thinking a report formula using the Count function. Is that right?