Code Pages are wild!
Hey everyone! Not sure if you all have spent much time playing around with the capabilities of code pages, but Kojo and I wanted to just say... there are some incredible things you can do in there. Especially when you leverage AI tools like claude / codex... A full customer-facing website — We just completely moved our customer-facing website (EOTI) into a code page. Yes, a real website, living inside Quickbase. A flappy bird style game — We also built a game with a live leaderboard (we'll be doing a full on competition at empower!) Something free coming to the Exchange — We have something really exciting in the works that we can't wait to share. It'll be free, and it's the kind of tool that could genuinely benefit anyone's realms! Feel free to reach out anytime! — Cam153Views2likes4Comments
Connecting QB to a client facing portal..
Hi all—apologies if this has already been covered. I did a quick search but didn’t find anything that quite fits my situation. I’m a solo travel operator and have been using Quickbase for over 10 years to manage transaction accounting (air tickets, manifests, hotel stays, etc.). It’s been a great fit for how I run my business. Recently, my model has shifted a bit, and I now need to provide a client-facing portal for select clients. I know this can be done within Quickbase, but I’m looking for something that better aligns with my brand aesthetic and overall client experience. I’ve been testing Outportal and have already built a working version of the portal. I really like the look, feel, and functionality it offers. I understand this likely means going the custom API integration route, which I’m comfortable with. My question—before I go too far down that path—is this: Is there a similar solution that integrates more natively with Quickbase? Or is there a better approach I should be considering? Appreciate any insight—thank you.112Views1like4CommentsEmbed a report from another app in a page (not a dashboard)
I have a page (not a dashboard) we are using as a homepage for our app and it has just come up that we would like to display a particular report from one of our other apps. I know this is a simple ask to do with a dashboard, but I'm not sure if there's a good way to do it on just a regular page. I am considering rebuilding the page as an actual dashboard at some point, but that is a bigger project and I figured I would ask here in case anyone knows of an easy way to do this in the meantime. I have tinkered around with creating a dashboard showing just my desired report in the source app, then embedding web page in my destination page, but that never seem to work. I also tried creating a code page in my source app and populating it with the iframe embed code QB generates for you when you select the Share icon on a dashboard... <head></head> <body> <iframe width="800" height="500" src="[my app string]?a=showpage&pageIdV2=24b11780-3e68-4fb7-ac1e-c25237440095&embedMode=1&ifv=1&hidefilters=1&hidealldashboardtabs=1&denydashboardediting=1"></iframe> </body> ...but I still just get a "refused to connect" error, even just trying to view the code page manually. I assume I'm doing it wrong here, but is it even possible to do what I'm trying to do?Solved148Views1like6Comments
Apply Dashboard Filter across all Tabs
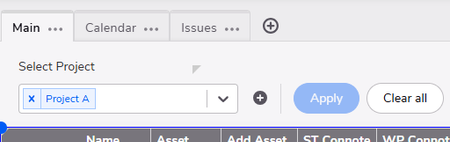
Hi, Is there any way to apply a dashboard filter to cover all tabs? The filter works fine when all the reports are on the same tab, but if I want to split reports across tabs, then it's very inconvenient to ask the user to select the same item across every tab to get what they want. e.g. You select the Project via the "Main" tab and it will filter all reports across the "Main", "Calendar" and "Issues" tabs for that selected Project. Thanks.141Views1like1Comment
New Dashboard Bug, any work arounds?
I haven't heard back from customer service, but from my testing I am confident that there is the following bug with new dashboards. When using a chart that includes a summary formula as one of the values you display (Gross Margin % for example), the new dashboards will NOT display this chart. I can't think of any workaround, besides going old school and making summary tables (which I want to avoid of course at this point). Not sure if anyone else has run into this, but if you have, please create a ticket so that perhaps it gets on their radar. Also, another interesting bug is if you make a chart using summary formulas, you cannot change the color of the bar/line/pie slice. For example, if I make a line chart with Gross Margin % as the line, and that value is derived from summary formulas, that line will only be available in the default blue color. If you change the color it always reverts back to the default color. If someone has a work around or can confirm these bugs, please let me know! ------------------------------ Mike Tamoush ------------------------------93Views1like4CommentsHow to prevent viewers from modifying a dashboard
I just created a dashboard and am trying to add new users with the role of "viewers" instead of "administrators" so they can't modify the dashboard. Is there a way to prevent somebody set up as "viewer" from unlocking and modifying a dashboard? (there is a lock icon at the top right of the dashboard to prevent making changes, but "viewers can unlock it to modify the dashboard). ------------------------------ Joseba Celaya ------------------------------25Views1like1Comment