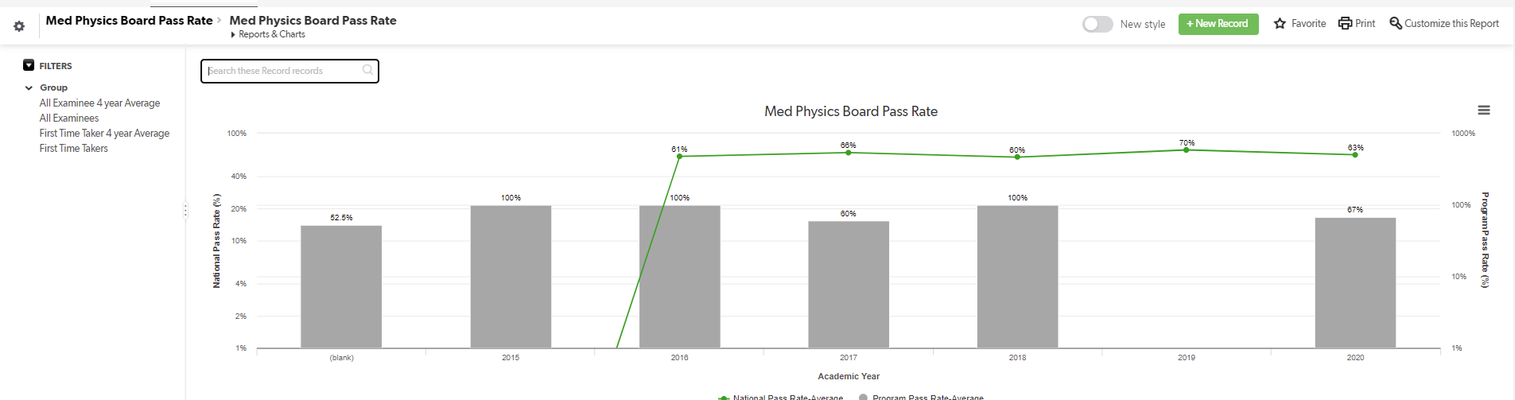
ContributionsMost RecentMost LikesSolutionsCharting/ Table help Hi All, I am currently working on a chart to show how many Rotators a Physician has each month. I have a table that tracks the name of the rotator, 5 separate fields for physicians (rotators are paired with 5 different physicians) (the fields are : physician 1 physician 2, etc), start date, end date, month,and year. Does anyone have any tips on how to chart the number of rotators seen by a physician per month. I have the # of observers as my Y-Axis, however, I cannot track all the physicans on the X-Axis since I have 5 fields for this. The only way I can think to fix this is by getting rid of 4 physician fields, and creating a new rotator entry for each physician; however, that would skew the data of the number of observers. Any help is appreciated. Thank you! Line and Bar Chart HelpHello All, I am trying to make a lien and bar chart that will have the academic year as the x axis, program pass rate as the y axis (bar), and national pass rate as the y axis (line). I am trying to show the relation of my programs testing scores for a particular year to that of the national average for that same year. When I go to graph this on my chart it does not show up the correct way/ is disproportional. I will attach a sample picture but visually the graph shows that the program pass rate is way below the national pass rate when it is the opposite. Is there a formula or another way to group the two by the same amount so it shows the right way ( it groups the program pass rate by: 1%, 10%, 100%, 1000% and groups the national pass rate by: 1%, 2%, 4%, 10%, 20%, 40%, and 100%) Any advice is greatly appreciated! Report HelpI have created a table for the one group in my department. Within that group there are a couple of different job types. When creating a report, is there a way to only include certain members of the group? Example: I have a table of Nurses, I have created a field called Nurse type. I want to create a report for Nurse coordinators. Can I make a report using the field "Nurses" without having all the nurse types in my report? ------------------------------ Campbell H. ------------------------------ Parent to Child RelationshipsI am confused about parent to child relationships within a singular table. In my app "Competencies" I have a table for each type of staff. In my table for nurses, I track all competencies for nurses, however, I want to make it that each nurse competency type has many of the same types. Would I be able to make a parent to child relationship for the fields within this one table. If so how would I be able to do this ? ------------------------------ Campbell ------------------------------ Re: Formula: Color Coding and DatesThank you! Do you know if there is a way to color code the numbers in a field? For example, an employee has worked for 5-10 years the field would be green, etc.Formula: Color Coding and DatesHello All! I am new to Quickbase and I am having trouble finding out how to code. I need to make a report that tracks all employees and how long they have worked at my company. I have the basic information, (I.e. Start date, employee, etc.) but I was wondering of there would be an easier way to automatically calculate how long the employee has worked from when they were hired until the present date. I also need to find out how to code those times in to different sections (green= 0-1 years, blue= 1-5, etc) so I can graph that info. If anyone has any suggestions or can point me in the right direction to go that would be amazing! ThanksFormula: Color Coding and DatesHello All! I am new to Quickbase and I am having trouble finding out how to code. I need to make a report that tracks all employees and how long they have worked at my company. I have the basic information, (I.e. Start date, employee, etc.) but I was wondering of there would be an easier way to automatically calculate how long the employee has worked from when they were hired until the present date. I also need to find out how to code those times in to different sections (green= 0-1 years, blue= 1-5, etc) so I can graph that info. If anyone has any suggestions or can point me in the right direction to go that would be amazing! Thanks